BSE Realty Index clocks 204 Pc growth amid COVID-19, outperforms other sectoral indices


Two years into the pandemic, India Inc and the population at large have been on a veritable rollercoaster ride. Nation-wide lockdowns, localized intermittent restrictions on the back of new COVID-19 variants have become a become a part of life.
After considerable apprehensions over the future when the pandemic first broke out, the fact that life must go on despite the virus has sunk in. India's economy rebounded quickly on the back of nation-wide vaccine rollout, as is evidenced by the country's GDP growth.
|
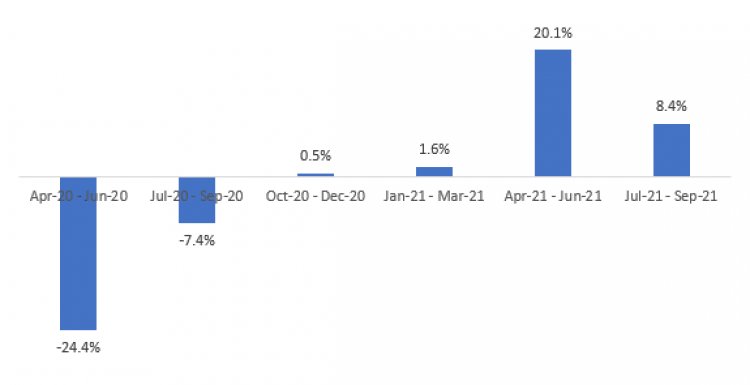
India GDP Growth Trends |
|
|
Source: Ministry of Statistics and Programme Implementation (MOSPI), ANAROCK Research |
India’s GDP growth improved in the recent quarters and as per National Statistical Office (NSO) estimates, it can clock 9.2% in FY22 after contracting 7.3% in FY21. Of course, a lot depends on the broad-based impact of the currently active Omicron variant.
Indian Stock Market
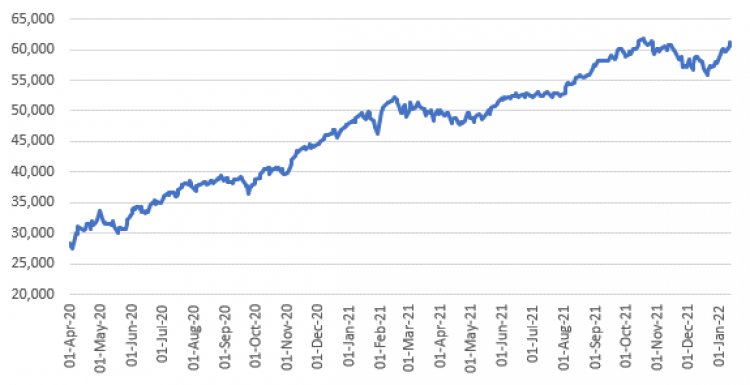
The Indian bourses have been remarkably resilient since the pandemic outbreak. After an initial decline in activity, the Indian stock markets saw considerable liquidity infusions, leading to notably high returns on many stock categories. S&P BSE Sensex, the broad indicator of the stock market performance, once again crossed the 61,000 mark on 12th Jan 2022 and is 2.2X of 1st Apr 2020 - registering a 116% growth.
|
S&P BSE Sensex |
|
|
Source: BSE India, ANAROCK Research |
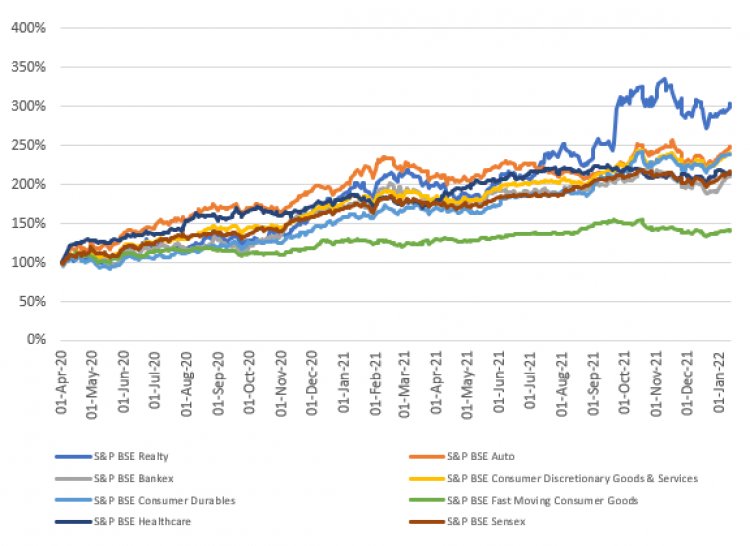
Moreover, S&P BSE Consumer Durables Index, S&P BSE Consumer Discretionary Goods & Services Index, and S&P BSE Auto Index grew 138%, 140%, and 149%, respectively between 1st Apr 2020 to 12th Jan 2022. And there’s more.
Anuj Puri, Chairman – ANAROCK Group, says “The S&P BSE Realty Index, an indicator of real estate companies’ performance on the bourses, grew 204% between 1st Apr 2020 to 12th Jan 2022, surpassing all sectoral indices’ returns as well as outperforming the broader market. Several unique developments helped boost real estate demand to such an extent that the Realty Index outperformed the other sectors as well as the broader market.”
Factors that drove residential demand
- Real estate buyers increasingly patronize large, reputed developers, and are willing to bear the implied premium or extra cost
- Homeownership went from choice to necessity in a pandemic that required people to spend unprecedented lengths of time at home. Restrictions imposed by housing societies on tenants’ movement also boosted the demand for ownership homes
- Volatility in the prices of physical assets was negligible when compared to other investment avenues, increasing the popularity of real estate as an investment asset class
- Interest rates were at a decadal low, bringing mortgage costs down significantly
- Structural changes have improved the perception of the Indian real estate sector as more organized and dependable than it was half a decade ago
- NRIs are once again very active on the Indian residential real estate market
As per ANAROCK Research, the market share of listed developers is rising, with their sales share of overall residential area sold across the top cities tripling from 6% in FY17 to 18% by H1 FY22.
|
S&P BSE Indices, indexed to 1st Apr 2020 |
|
|
Source: BSE India, ANAROCK Research |
The resilience of the Indian real estate sector has been repeatedly vindicated over the past few years. A quick look at the performance of all the above indices since 1st April 2021 (coinciding with the 2nd wave of the pandemic) also depicts that the S&P BSE Realty Index has once again hit a home run.
|
Date |
S&P BSE Realty |
S&P BSE Auto |
S&P BSE Bankex |
S&P BSE Consumer Discretionary Goods & Services |
S&P BSE Consumer Durables |
S&P BSE Fast Moving Consumer Goods |
S&P BSE Healthcare |
S&P BSE Sensex |
|||||||||
|
1st Apr 2021 |
2678.16 |
22590.96 |
38239.36 |
4648.46 |
32809.05 |
12867.07 |
21528.53 |
50029.83 |
|||||||||
|
12th Jan 2022 |
4026.1 |
26371.57 |
44221.83 |
6049.77 |
45870.92 |
13979.19 |
25614.16 |
61150.04 |
|||||||||
|
% Change |
50% |
17% |
16% |
30% |
40% |
9% |
19% |
22% |